In the high-stakes world of engineering, building complex systems demands constant vigilance. Imagine meticulously crafting a machine yet lacking the ability to see its inner workings. Frustrating, right?
That’s where engineering analytics systems come in. These powerful tools act as your X-ray vision, revealing hidden insights into system behavior. No more flying blind – you can identify bottlenecks, optimize performance, and make data-driven decisions that ensure smooth operation.
This translates to real-world benefits; faster troubleshooting, smarter resource allocation, and, ultimately, superior systems.
Ready to harness the power of engineering analytics? At IntelliSoft, with over 15 years of experience, we can help you navigate this exciting frontier and unlock the full potential of your engineering teams.
Let’s dive deep and explore how engineering analytics systems can empower you to build better, faster, and smarter.
Table of Contents
What Are Engineering Analytics and Systems?
Engineering analytics is the missing puzzle piece in the world of complex system development. It’s the bridge between the intricate inner workings of your systems and the crucial decisions you make to keep them running smoothly.
Imagine peering into the heart of your creation, not just seeing its function but understanding its every beat and hum. That’s the power of engineering analytics.
Collecting and analyzing data generated by your development tools acts as a diagnostic lens, revealing hidden inefficiencies, performance bottlenecks, and potential bugs. It’s like having a constant health check on your systems, allowing you to identify and address issues before they snowball into major roadblocks.
But engineering analytics systems examples go beyond mere troubleshooting. It empowers you to optimize your system’s performance. By understanding resource utilization, you can make data-driven decisions about allocation, ensuring your systems run at peak efficiency.
This newfound knowledge also fosters informed decision-making. Engineering analytics helps uncover trends and patterns hidden within the data, providing valuable insights to guide strategic choices about system configuration, upgrades, and future development.
The most significant impact lies in fostering collaboration. By sharing these insights and visualizations with your team, engineering analytics creates a shared understanding of the system’s health. This transparency fosters better communication, problem-solving, and a more efficient and productive engineering environment.
As Tim O’Reilly, founder and CEO of O’Reilly Media, aptly stated, “We’re entering a new world in which data may be more important than software.” In this new world, engineering analytics becomes the key to unlocking the true potential of your software and development efforts. It empowers you to not only build complex systems but to understand and optimize them for peak performance truly.
Why Do You Need an Engineering Analytics Platform?
Engineering analytics systems examples act as your GPS in this complex landscape, providing real-time data and insights to optimize your development process. Here’s why you need one:
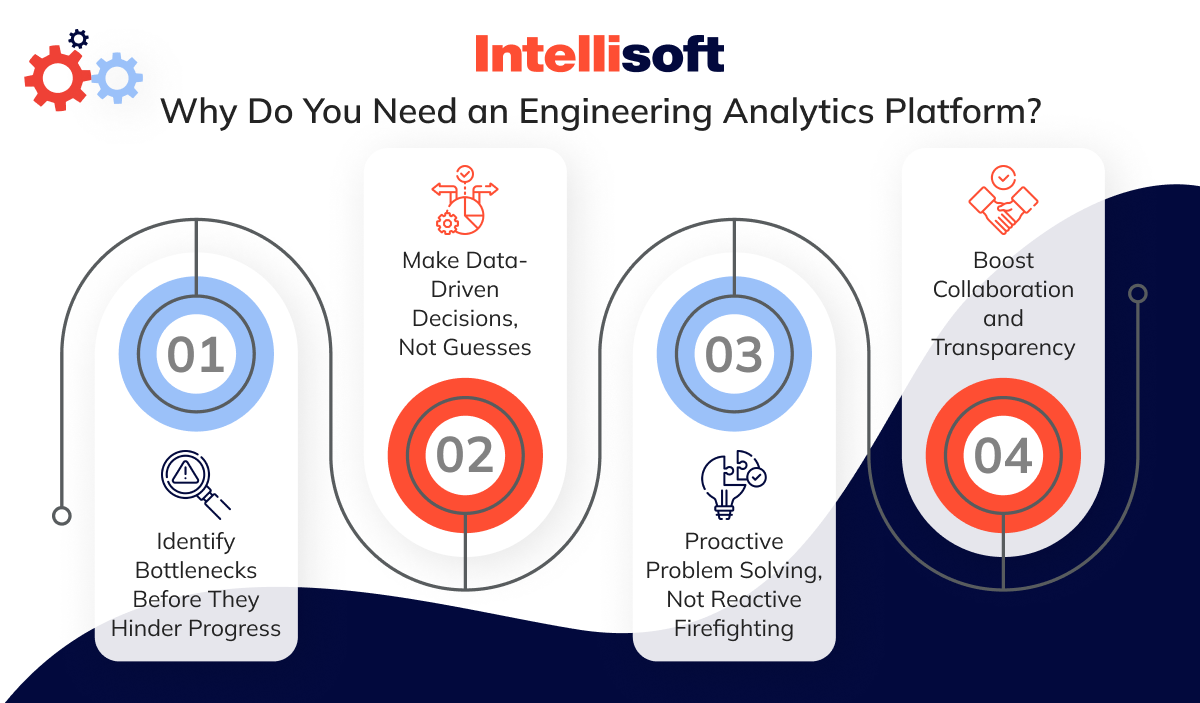
Identify Bottlenecks Before They Hinder Progress
Is a slow database query causing delays in your application’s response time? An engineering analytics platform can pinpoint these bottlenecks by analyzing performance metrics.
Imagine a development team working on a new e-commerce platform. Suddenly, during peak shopping hours, the checkout process grinds to a halt.
Without analytics, troubleshooting becomes a guessing game. However, with an analytics platform, the team can quickly identify a poorly optimized database query that’s causing the bottleneck. This allows them to fix the issue and ensure a smooth checkout experience for customers.
Make Data-Driven Decisions, Not Guesses
Allocating resources for your growing development team is crucial. But how do you know where to invest?
Engineering analytics provides insights into resource utilization, helping you identify areas where additional resources are needed. For example, the platform might reveal that a specific development team is consistently overloaded while another has spare capacity.
This data-driven insight allows you to strategically redeploy resources to ensure optimal workload distribution and team efficiency.
Proactive Problem Solving, Not Reactive Firefighting
Wouldn’t it be better to anticipate issues before they arise? Engineering analytics platforms can analyze historical data and identify trends that might indicate potential problems. For instance, the platform might detect a gradual increase in memory usage over time, suggesting a potential memory leak in your application. By proactively addressing this issue, you can prevent a major system outage before it happens.
Boost Collaboration and Transparency
Development teams often work in silos, leading to communication gaps and inefficiencies. Engineering analytics platforms bridge this gap by providing a shared view of system health and performance. Everyone on the team can access real-time data and visualizations, fostering better communication and collaboration.
Imagine a developer pushing a new code update, causing a sudden performance dip. With an analytics platform, the entire team can see this issue reflected in the data, allowing them to quickly pinpoint the problematic update and work together to resolve it.
What Are the Benefits of Using Engineering Analytics Systems?
Engineering analytics systems aren’t just buzzwords; they’re catalysts for real change. These powerful tools empower organizations to transform their development processes from reactive scrambles to data-driven sprints towards success. Here’s how:
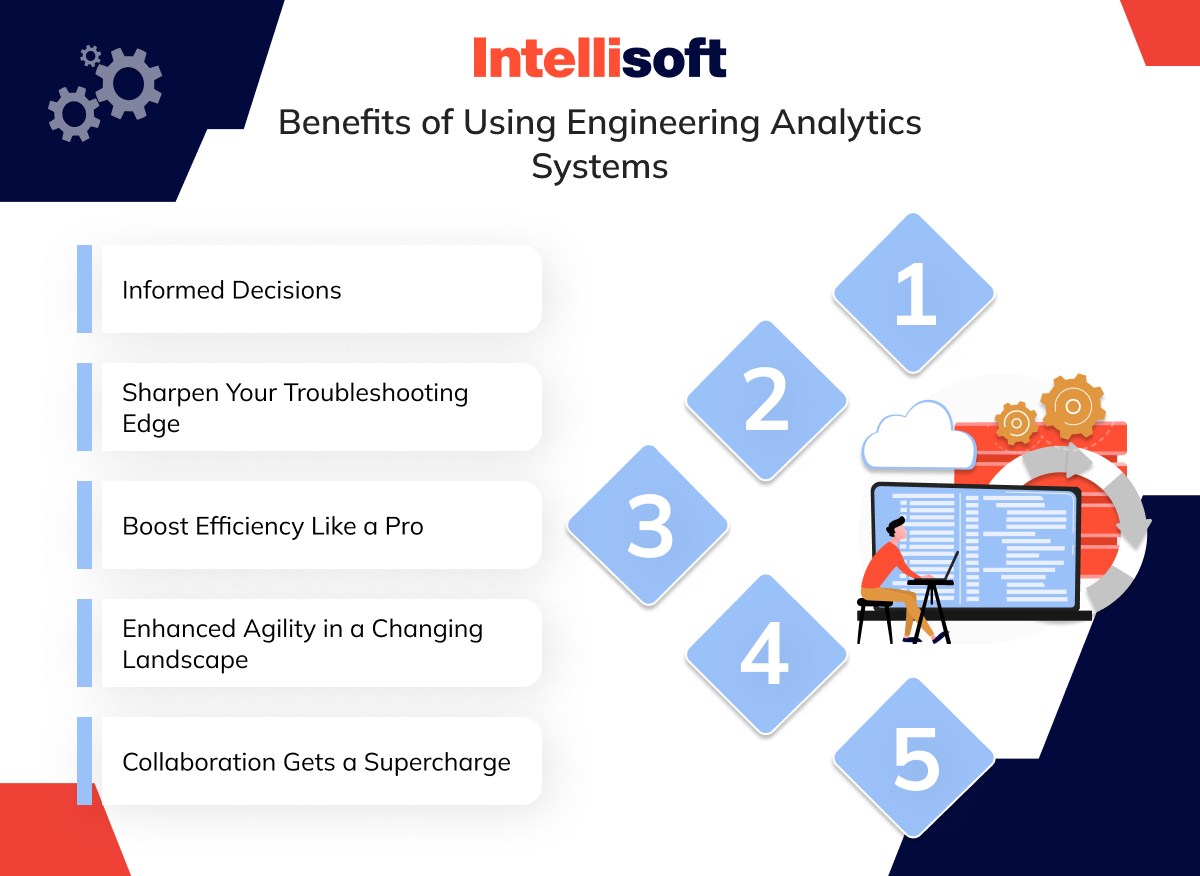
Informed Decisions
Intuition and gut feeling used to be the driving force behind critical choices. Engineering analytics ushers in a new era of data-driven decision-making. By uncovering hidden trends and patterns within the data, it provides invaluable insights to guide strategic choices about system configuration, upgrades, and future development. Imagine a team debating a major software upgrade. The analytics system can analyze historical performance data and predict the potential impact, allowing the team to make an informed decision based on cold, hard data.
Sharpen Your Troubleshooting Edge
Engineering analytics systems act as a diagnostic superpower, revealing bottlenecks, performance issues, and potential bugs lurking within your complex systems. No more wrestling with cryptic error messages or spending hours chasing down elusive gremlins. Imagine a development team facing a sudden surge in server errors. By analyzing system logs and performance metrics, the analytics system can pinpoint the exact line of code causing the issue, saving the team precious time and frustration.
Boost Efficiency Like a Pro
Just as a finely tuned engine purrs with efficiency, engineering analytics systems empower you to optimize your systems for peak performance. For example, the analytics system might reveal that specific servers are consistently overloaded during peak usage times. With this knowledge, the team can strategically migrate some workloads to underutilized servers, ensuring smooth operation and optimal resource utilization.
Enhanced Agility in a Changing Landscape
In today’s fast-paced world, agility is key. Engineering analytics systems provide real-time data and insights, allowing organizations to adapt quickly to evolving market conditions. Imagine a situation where a competitor launches a new feature that significantly impacts user behavior. The analytics platform allows the team to see this shift reflected in the data, facilitating a swift response and strategic adjustments to maintain their competitive edge.
Collaboration Gets a Supercharge
Development teams often operate in silos, hindering communication and leading to inefficiencies. Engineering analytics systems bridge this gap by fostering transparency and shared understanding. The analytics platform allows the entire team to see this issue reflected in the data, facilitating communication and collaboration to identify and resolve the problem swiftly.
Related articles:
- Top 10 Data Warehouse Software Tools for Your Business
- How to Master an Enterprise Data Warehouse: a Complete Guide
- Predictive Analytics in Retail: Boosting ROI and Transforming Customer Experience
- Best Tech Stack for Optical Character Recognition Automation
- Best programming languages for AI and machine learning
What to Look for in an Engineering Analytics Solution
Choosing the right engineering analytics solution is no small feat. It’s like selecting the ideal compass and climbing gear for an expedition. The chosen tools will determine how you navigate the path and find the best solution in any situation. Here’s a detailed breakdown of the crucial features of engineering analytics systems to consider when selecting your engineering analytics solution:
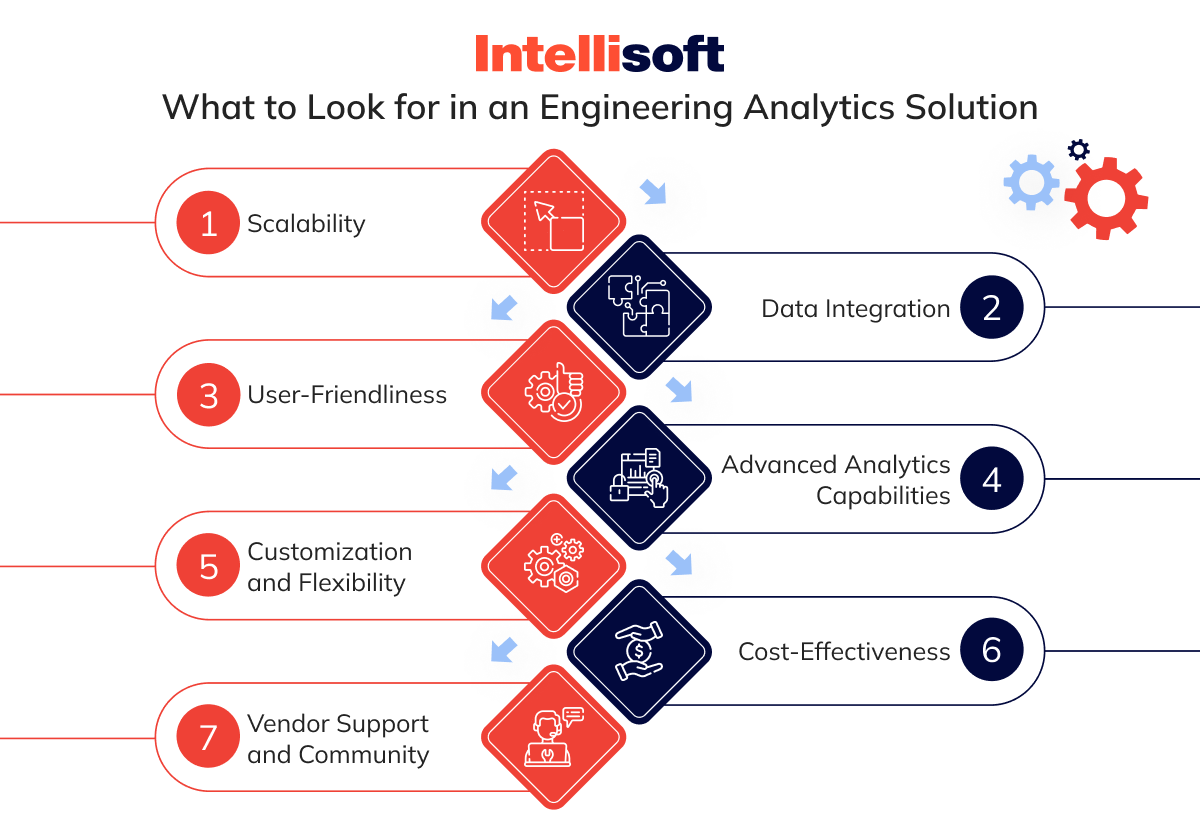
Scalability
Your systems are living, breathing entities, constantly growing and adapting. The last thing you need is an analytics solution that becomes a burden as your data volume scales.
Seek a platform that boasts seamless scalability, effortlessly accommodating ever-increasing data demands and user requirements. Imagine a company experiencing explosive user growth. Their initial engineering analytics solution, perfect for their startup phase, might buckle under the pressure of millions of new users.
A scalable solution, however, would seamlessly adapt, continuing to provide valuable insights without a hitch.
Data Integration
Engineering analytics thrives on a rich tapestry of data. The chosen solution should seamlessly integrate with your existing development tools and data sources.
This ensures effortless data collection and analysis, eliminating the need for cumbersome workarounds and manual data entry. Imagine a development team struggling with a patchwork of data sources, each siloed and incompatible. A well-integrated analytics solution would bridge these gaps, creating a unified data stream for a holistic view of system performance.
User-Friendliness
Not everyone on your team will be a data scientist with a Ph.D. in deciphering complex charts and graphs. Choose a solution with an intuitive and user-friendly interface. This empowers users of all technical skillsets to access and understand the insights it provides. Imagine a complex analytics platform that only a select few data specialists can navigate. Valuable insights get lost in the labyrinthine interface, hindering broader team collaboration and decision-making.
Advanced Analytics Capabilities
Basic metrics are a good starting point, but they only paint part of the picture. Look for a solution that offers advanced analytics capabilities like anomaly detection, machine learning, and predictive analytics.
These features unlock hidden patterns within your data, allowing you to anticipate potential issues before they snowball into major problems. Imagine a development team relying solely on basic metrics to monitor system performance. A sudden surge in errors might go unnoticed until it explodes into a full-blown system outage. Advanced analytics, however, would detect the anomaly early on, allowing the team to take preventative measures and ensure system stability.
Customization and Flexibility
Your specific needs and workflows are unique. A one-size-fits-all approach simply won’t cut it. Choose a solution that allows for customization and configuration. This empowers you to tailor it to your specific data analysis requirements and seamlessly integrate it into your existing development processes. Imagine a rigid analytics platform that offers no room for customization.
A development team with a unique testing methodology might find the platform unusable due to its inflexible structure. A customizable solution, however, would allow them to adapt the platform to their specific testing processes, ensuring a smooth workflow.
Cost-Effectiveness
Budgetary constraints are a reality. The goal is to find a solution that delivers a strong return on investment (ROI).
Don’t be swayed by the allure of the cheapest option; prioritize a solution that offers the features and functionality that align with your specific needs, even if it requires a slightly higher initial investment. Imagine a company opting for a cheap, bare-bones analytics solution.
While it saves money upfront, it might lack the features needed to truly optimize development processes.
Vendor Support and Community
A strong support system is crucial during your engineering analytics journey. Look for a vendor with a responsive and knowledgeable support team to answer your questions and address any technical issues that may arise.
A vibrant user community is also invaluable. This platform allows for knowledge sharing, best practice discussions, and collaborative troubleshooting. Imagine encountering a complex data analysis challenge.
By leveraging both resources, you can overcome obstacles and extract maximum value from your engineering analytics solution.
Key 5 Engineering Analytics Solutions
Selecting the right engineering analytics solution requires understanding your specific needs and the strengths of each platform. Here’s a breakdown of five popular options and applications of data analytics in engineering:
LinearB
LinearB caters specifically to the needs of DevOps teams. It seamlessly integrates with popular development tools like Git, Jira, and Slack, becoming a natural extension of your existing workflow.
By analyzing data points such as cycle time, deployment frequency, lead time, and change failure rate, LinearB provides actionable insights to identify areas for improvement. Imagine a development team struggling with slow release cycles and a high rate of deployment failures. LinearB can pinpoint bottlenecks in the pipeline, such as lengthy code reviews or inefficient testing procedures.
Armed with this knowledge, the team can then take steps to streamline their workflow, leading to faster deployments and higher quality software.
Key Features
- Seamless DevOps Integration (Git, Jira, Slack)
- Actionable Insights (Cycle Time, Deployment Frequency, Lead Time, Change Failure Rate)
- User-Friendly Interface with Clear Visualizations
Advantages
- Simplifies data collection and analysis within the existing development ecosystem
- Provides clear, actionable insights to optimize DevOps workflows
- Offers an intuitive interface for users of all technical skillsets
Disadvantages
- Lacks advanced analytics capabilities like machine learning or predictive modeling
- May not be ideal for highly complex systems with intricate data needs
ThoughtSpot
A full-fledged business intelligence (BI) platform designed for intuitive data exploration. This means users can delve into complex datasets using natural language queries, eliminating the need for extensive technical expertise.
Moreover, ThoughtSpot boasts advanced analytics features like forecasting and trend analysis, allowing you to anticipate future challenges and make informed strategic decisions.
Key Features
- Natural Language Search for Intuitive Data Exploration
- Advanced Analytics Capabilities (Forecasting, Trend Analysis)
- Scalable Architecture to Accommodate Large Datasets
Advantages
- Democratizes data analysis through natural language search
- Offers advanced functionalities for in-depth data exploration
- Scales effortlessly to meet the needs of large organizations with vast datasets
Disadvantages
- Can be a more expensive solution compared to other options on this list
- Advanced functionalities might have a steeper learning curve for non-technical users
ZenHub
Built directly on top of GitHub, ZenHub bridges the gap between project management and development analytics. It seamlessly integrates with your existing GitHub repositories, offering features like burndown charts, velocity tracking, and workload management.
Imagine a development team struggling to visualize their progress and identify potential roadblocks within their GitHub projects. ZenHub provides clear visualizations that track team progress in real-time, allowing for proactive adjustments and course corrections.
Key Features
- Tight Integration with GitHub for Seamless Workflow
- Project Management Features for Enhanced Collaboration
- Visualizations to Track Team Progress and Identify Roadblocks
Advantages
- Streamlines development processes for teams already utilizing GitHub
- Provides basic analytics functionalities to enhance project management
- Offers clear visualizations for improved team communication and collaboration
Disadvantages
- Limited to the functionalities of the GitHub ecosystem
- Lacks advanced analytics capabilities for in-depth data exploration
Hatica
Hatica provides a comprehensive view of your application’s health, code performance, and user behavior. Imagine a development team experiencing a sudden surge in application crashes. Hatica can pinpoint the exact line of code causing the issue, allowing for a swift resolution and minimal disruption to users. Additionally, Hatica offers real-time data on user behavior, allowing you to identify areas for improvement in the user experience.
Key Features
- Deep Application Performance Monitoring Capabilities
- Proactive Identification and Troubleshooting of Performance Issues
- Real-Time Data for Immediate Insights
Advantages
- Provides in-depth insights into application health and performance
- Enables proactive identification and troubleshooting of potential issues
- Offers real-time data for immediate decision-making and course correction
Disadvantages
- Primarily focused on APM, with limited functionalities for broader development analytics
- Pricing structure might not be suitable for all budgets, particularly for smaller teams
Stackin
Stackin caters specifically to development teams utilizing continuous integration/continuous delivery (CI/CD) pipelines. It integrates seamlessly with your existing CI/CD tools, automatically collecting data throughout the build and deployment process. Stackin then analyzes this data, providing insights into build times, deployment success rates, and test coverage.
Key Features
- Seamless Integration with CI/CD Pipelines for Automated Data Collection
- Actionable Insights for Optimizing CI/CD Workflows (Build Times, Deployment Success Rates, Test Coverage)
- Scalable Architecture to Accommodate Growing Development Teams
Advantages
- Simplifies data collection within the existing CI/CD workflow
- Provides actionable insights for optimizing CI/CD processes
- Scales effortlessly to meet the needs of growing development teams with complex pipelines
Disadvantages
- Primarily focused on CI/CD analytics, may not offer broader development insights
- Might have a learning curve for those unfamiliar with CI/CD concepts
Conclusion
Engineering is a vast ocean, brimming with potential but fraught with hidden currents. In the past, navigating these waters relied on instinct and a bit of luck. Today, engineering analytics systems act as your compass and GPS, guiding you towards smoother sailing and superior software.
These powerful tools shed light on the inner workings of your systems, revealing bottlenecks and inefficiencies that might otherwise go unnoticed. Imagine a development team struggling with sluggish performance. Engineering analytics pinpoint the issues – slow database queries or inefficient code. Armed with this knowledge, the team can optimize their systems for peak performance, ensuring a more seamless user experience.
The result? A development environment that thrives on collaboration and agility. Everyone on the team has access to real-time insights, fostering better communication and problem-solving.
Ready to chart a course towards engineering excellence? At IntelliSoft, with over 15 years of experience, we’re your trusted partner in this exciting journey. We offer a comprehensive suite of engineering analytics solutions designed to empower your development teams.
Contact IntelliSoft today and let’s navigate the path to success together.


