Ever feel like you’re constantly chasing deadlines while wrestling with code quality? You’re not alone. Many development teams face this struggle – the pressure to be fast, deliver high-quality work, and hit those ever-tight deadlines can feel like a constant juggling act.
Enter the world of software development analytics tools. These aren’t just fancy trackers – they’re powerful tools that use data to show how your team works clearly. Imagine being able to identify bottlenecks before they slow you down, streamline your workflows for maximum efficiency, and ultimately deliver software that not only meets expectations but surpasses them.
Sounds interesting? At InteliSoft, with over 15 years of experience in data analytics and software development, we’ve seen this challenge countless times. Learn how software development analytics tools can transform your development process and help you achieve your goals.
Table of Contents
What Is a Software Development Analytics Tool?
Software development analytics tools are like secret weapons for your development team. They go beyond the basic tracking capabilities of traditional Git tools to provide a deeper understanding of your entire workflow.
These tools aren’t just for managers. Developers of all levels can benefit from the insights they offer. They help you see the bigger picture by tracking key metrics, such as:
- Commits and Pull Requests. These tools analyze the frequency and size of code changes, providing insights into team activity and potential bottlenecks.
- Code Quality. They can identify areas of code that might be prone to bugs or could be written more efficiently.
- Deployment Frequency. Track how often new features and bug fixes are released, helping you understand your team’s velocity.
- Bug Resolution Time. Identify areas where bug fixing slows down the process, allowing you to prioritize effectively.
By analyzing this data, software development analytics tools empower you to:
- Pinpoint Bottlenecks. Identify areas where your development process is slowing down, allowing you to focus on streamlining workflows.
- Optimize Workflows. Use data to understand how your team works best and make adjustments for maximum efficiency.
Why are software development analytics tools necessary?
You might be thinking, “Don’t we already track some of this information with our existing tools like Git?” While traditional Git tools are great for version control, they offer a limited view of your development process. Analytics software development tools go a step further, providing a holistic picture by:
- Unifying Data Sources. They pull data from various sources like code repositories, issue trackers, and deployment tools, offering a comprehensive overview.
- Advanced Analytics. These tools go beyond basic tracking by offering powerful analytics that reveal hidden patterns and trends within your development workflow.
- Actionable Insights. They don’t just present data – they translate it into actionable insights that help you identify areas for improvement and make informed decisions.
Think of it like this; Imagine navigating a dark forest with only a flashlight. Traditional Git tools offer that limited view. Software developer analytics tools, on the other hand, are like switching on a powerful light, illuminating the entire path ahead, revealing obstacles and helping you navigate your development process with greater efficiency.
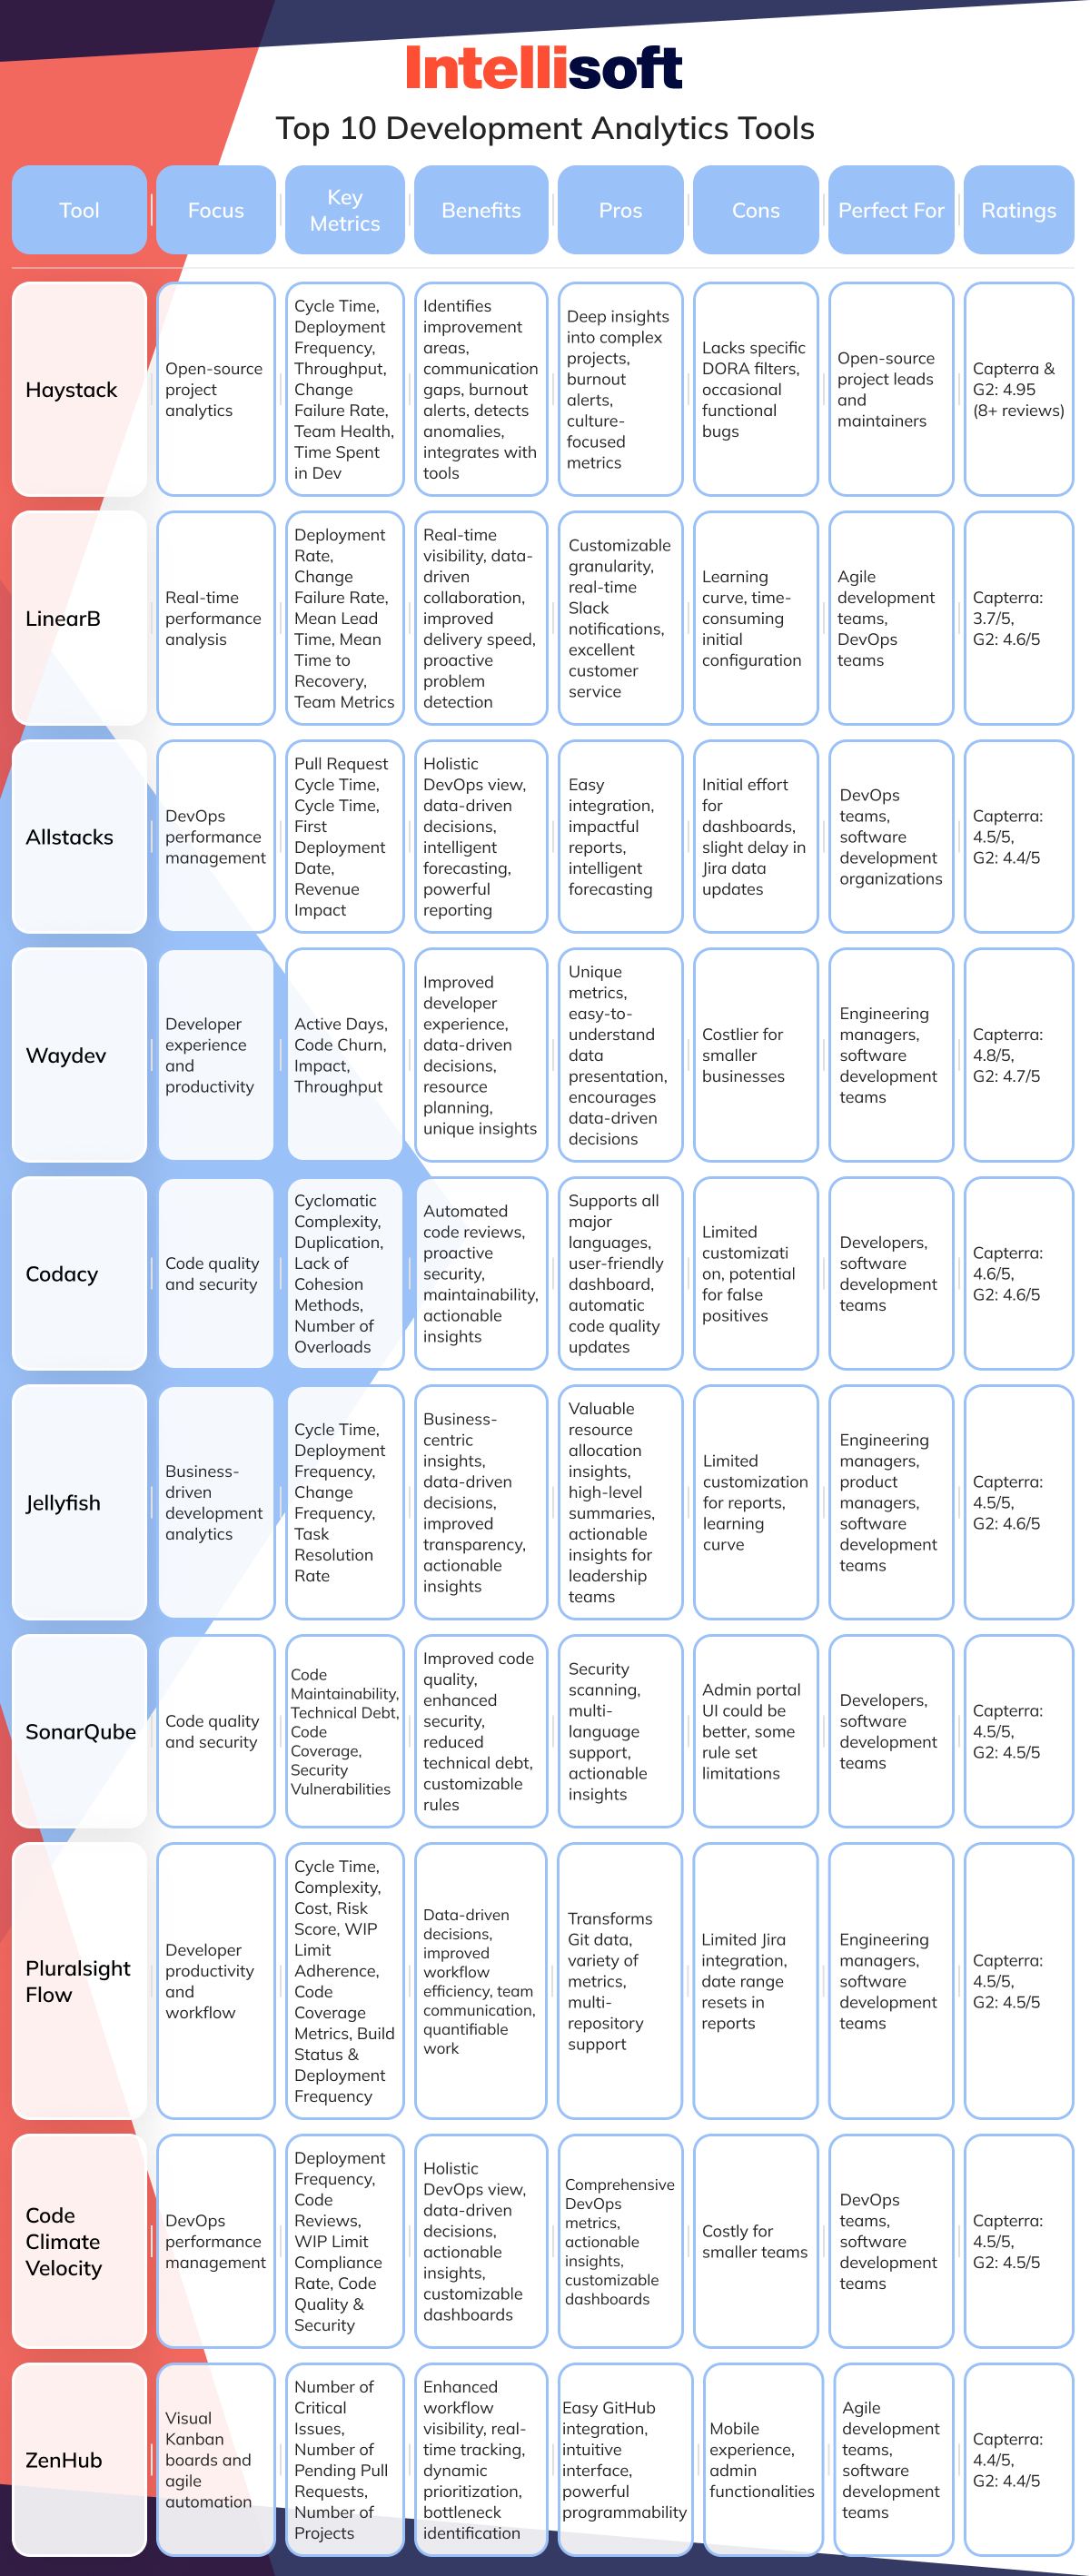
Top 10 Development Analytics Tools
Ready to unleash the power of data and transform your development process? Here’s a look at 10 top software development analytics tools for tech team managers and developers to consider:
Haystack
Developed by the Massachusetts Institute of Technology, Haystack is a game-changer for open-source project leaders and maintainers. Unlike traditional tools, Haystack goes beyond basic tracking to offer deep insights into the inner workings of large, complex open-source projects.
Focus: Open-source project analytics
Key Metrics:
- Cycle Time. Measures time from commits (bug fixes, tasks) to merge.
- Deployment Frequency. Tracks the number of deployments per day.
- Throughput. Shows tasks completed per minute, helping identify bottlenecks.
- Change Failure Rate. Measures errors triggered by code changes.
- Team Health. Identifies factors like overwork and burnout.
- Time Spent in Dev. Tracks developer coding time per day/week/month.
Benefits:
- Identifies areas for improvement within the project
- Uncovers communication gaps between developers
- Fosters a more collaborative development environment
- Sends burnout alerts (unique feature)
- Detects anomalies and alerts instantly
- Helps measure culture-focused metrics too (e.g., burnout)
- Integrates with multiple tools
Cons:
- Lacks specific filters for exact DORA metrics (industry standard metrics)
- Can have occasional functional bugs
Who is it perfect for? Open-source project leads and maintainers.
Rating: Capterra & G2 Average Rating: 4.95 (8+ reviews)
LinearB

While traditional Git tools excel at version control, LinearB software development analytics tool takes it a step further. This real-time performance analysis platform acts like a mission control center for your development team.
Focus: Real-time performance analysis platform
Key Metrics:
- Deployment Rate. Tracks how often deployments occur, providing insights into team velocity and delivery efficiency.
- Change Failure Rate. Measures the number of bugs introduced in code changes, helping identify areas for improvement in code quality.
- Mean Time to Recovery. Measures team member effort spent fixing bugs introduced by changes.
- Team Metrics. Tracks a variety of team health indicators, including velocity (rate of work completion), throughput (work completed per unit time), work-in-progress (active tasks), cycle time per task category (e.g., design), and incomplete tasks.
Benefits:
- Real-time Visibility. Gain instant insights into team activity, identify bottlenecks, and make adjustments on the fly.
- Data-Driven Collaboration. Analyze pull request data to understand team communication patterns and identify areas for improvement.
- Enhanced Workflow Efficiency. Track lead time to pinpoint stages that slow down development and optimize workflows for faster delivery.
- Improved Delivery Speed. Monitor deployment frequency to understand how often your team is releasing value to users.
- Perfect for Agile Teams. Aligns perfectly with Agile methodologies that emphasize continuous improvement and data-driven decision making.
- Detailed Insights. LinearB goes beyond simple team rollups. It captures time spent on tasks by category (designing, coding), allowing you to measure individual and team velocity.
- Proactive Problem Detection. Receive real-time updates about project delivery dates and alerts for potential issues, enabling proactive problem-solving.
- Automation Potential. Identify repetitive tasks that can be automated, streamlining development processes.
- Seamless Integration. Integrates with popular tools like Slack, Shortcut, and Jira for easy monitoring and communication.
Pros:
- Integrates with popular issue tracking platforms
- Offers customizable granularity (analyze performance from individual to entire organization)
- Provides real-time Slack notifications for issues
- Excellent customer service
Cons:
- Has a learning curve for new users
- Initial configuration can be time-consuming
Who is it perfect for? Agile development teams, DevOps teams
Ratings: Capterra: 3.7 out of 5 stars, G2: 4.6 out of 5 stars
Related articles:
- Top 10 Data Warehouse Software Tools for Your Business
- How to Master an Enterprise Data Warehouse: a Complete Guide
- Predictive Analytics in Retail: Boosting ROI and Transforming Customer Experience
- Best Tech Stack for Optical Character Recognition Automation
- Best programming languages for AI and machine learning
Allstacks
Allstacks isn’t just another development analytics tool; it’s a command center for optimizing your entire software delivery process. Imagine having a central hub that provides a clear picture of team performance, identifies trends, and prioritizes development efforts based on real-time data. That’s the power Allstacks brings to the table.
Focus: DevOps performance management platform
Key Metrics:
- Pull Request Cycle Time. Tracks the average time it takes to approve or reject a pull request. High values can indicate inefficient code review, leading to potential bugs and delayed releases.
- Cycle Time. Measures the overall time it takes your team to complete a project, from initial ticket submission to testing and deployment. Shorter cycle times indicate a more efficient development process.
- First Deployment Date. Tracks the date of your team’s first successful deployment to production servers. This metric helps monitor progress and identify potential delays in release management.
- Revenue Impact. A unique metric that estimates potential revenue loss due to bugs or delayed feature releases. Higher values suggest a need for improved development practices to maximize customer engagement and profitability.
Benefits:
- Holistic View of DevOps Performance. Gain insights across the entire software delivery pipeline, identifying bottlenecks and optimizing workflow efficiency.
- Data-Driven Decision Making. Prioritize development efforts based on real-time data and actionable insights.
- Intelligent Forecasting. Identify potential risks and gain visibility into your project’s future trajectory through system development lifecycle analysis.
- Powerful Reporting. Generate insightful reports with over 120 engineering metrics, allowing you to track team progress and performance.
- Customizable Dashboards. Create shareable dashboards tailored to specific needs, providing visibility to stakeholders at all levels.
Pros:
- Easy to integrate with existing tools
- Generates impactful reports with actionable insights
- Offers intelligent forecasting capabilities
Cons:
- Creating meaningful dashboards can require initial effort
- Data updates from Jira projects might have a slight delay
Who is it perfect for? DevOps teams, software development organizations
Ratings: Capterra: 4.5 out of 5 stars, G2: 4.4 out of 5 stars
Waydev
Waydev goes beyond traditional development analytics by focusing on the developer experience itself. This agile tool empowers engineering teams to not only track output, but also identify areas to improve development processes and ultimately deliver a more polished final product.
Focus: Developer experience and productivity platform
Key Metrics:
- Active Days. This unique metric helps identify individual team member engagement. An Active Day represents a day where a team member contributes code (writing or reviewing) to the project. By tracking Active Days, managers can identify potential roadblocks or areas where developers need support.
- Impact. This metric goes beyond churn by measuring the “bigness” of code changes. Impact helps teams understand the relative significance of code modifications.
- Throughput. Tracks the total amount of code added, refactored, or removed within the project. By analyzing throughput, teams can gain insights into overall development activity and efficiency.
Benefits:
- Improved Developer Experience. Identify areas to optimize workflows and boost developer happiness and productivity.
- Data-Driven Decision Making. Gain insights into developer activity and code changes to make informed decisions about resource allocation and project priorities.
- Market-Based Metrics. Measure the return on investment (ROI) for specific projects, allowing you to identify features that contribute the most value and optimize product development strategy.
- Focus on Impact. Move beyond basic code churn and understand the true impact of code changes on the project.
- Resource Planning. Identify how bug fixes and scope creep affect delivery timelines and roadmap velocity, aiding in resource allocation and planning.
- Unique Insights. Waydev offers several unique metrics not found in other tools, providing a more comprehensive view of developer activity and code changes.
- Visually Appealing Data. Waydev presents data in a clear and easy-to-digest format, making it accessible to all team members.
Pros:
- Offers unique metrics for developer experience analysis
- Presents data in an easy-to-understand format
- Encourages data-driven decision making for resource allocation and project strategy
Cons:
- Can be a costlier option for smaller businesses
- Who is it perfect for? Engineering managers, software development teams
Ratings: Capterra: 4.8 out of 5 stars, G2: 4.7 out of 5 stars
Codacy

Codacy isn’t your average Git tracking tool. This automated code review guardian sits watch over your codebase, meticulously analyzing its quality with every pull request and commit.
Focus: Code Quality and Security for Developers
Key Metrics:
- Cyclomatic Complexity. Measures code complexity, helping identify methods that are difficult to understand, maintain, and extend. Codacy recommends refactoring such code for improved readability and maintainability.
- Duplication. Identifies code duplication within files and across your entire project. This helps catch potential issues that might be missed by traditional tools.
- Lack of Cohesion Methods (LCOM). This metric helps identify methods that are overloaded with functionality, making the code less modular. By analyzing LCOM, Codacy can point out potential design flaws in your project’s architecture.
- Number of Overloads. Identifies methods with too many dependencies, indicating potential code coupling issues. Codacy suggests ways to reduce method overloads, improving code maintainability.
Benefits:
- Effortless Code Reviews. Codacy automates code analysis across multiple programming languages and tools, providing comprehensive feedback on every pull request and commit. This saves developers time and ensures consistent code quality standards.
- Proactive Security. Identify and address security vulnerabilities before they become a critical issue, keeping your software safe and secure.
- Maintainability Made Easy. By pinpointing code complexity and duplication, Codacy helps developers write cleaner, more maintainable code, reducing long-term maintenance costs.
- Actionable Insights. Codacy doesn’t just report problems; it provides actionable suggestions for improvement, guiding developers towards better coding practices.
- Team Collaboration. Share code quality reports with your team on platforms like Slack or email, fostering communication and collaboration around code quality improvements.
- Seamless Integration. Integrates smoothly with your existing development workflow for a streamlined user experience.
Pros:
- Supports All Major Languages. Codacy analyzes code written in a wide range of programming languages, making it a versatile tool for diverse projects.
- Intuitive Interface & User-friendly Dashboard. Codacy’s interface is clear and easy to navigate, allowing developers to quickly understand code quality reports and take action.
- Automatic Code Quality Updates. Stay informed with automatic updates to your code quality rating, reflecting the impact of recent changes.
Cons:
- Limited Customization. For projects with specific code quality standards, Codacy’s customization options might be limited.
- Potential for False Positives. Codacy may identify some non-critical issues or enforce de facto standards that might not be relevant to your project.
Who is it perfect for? Developers of all levels, software development teams
Ratings: Capterra: 4.6 out of 5 stars, G2: 4.6 out of 5 stars
Jellyfish

Jellyfish acts as a bridge between your engineering efforts and business goals, providing valuable surface insights to help you align development with what truly matters – business value.
Focus: Business-driven development analytics platform
Key Metrics:
- Cycle Time. Measures the average time it takes to complete a task, from initiation to deployment. Lower cycle times indicate efficient workflows and faster delivery.
- Deployment Frequency. Tracks how often your team releases new features and bug fixes. Higher deployment frequency suggests faster delivery of value to customers.
- Change Frequency. Analyzes the rate at which code changes are introduced.
- Task Resolution Rate Over Time. Shows how quickly your team resolves issues over time. An improving trend indicates a more efficient development process.
Benefits:
- Business-Centric Insights. Gain a clear understanding of how your engineering work aligns with business objectives and delivers value.
- Data-Driven Decision Making. Make informed resource allocation decisions based on insights into project progress and impact on business goals.
- Improved Transparency. Jellyfish provides a holistic view of your development process, from code changes to deployments, fostering transparency across teams and stakeholders.
- Actionable Insights. Transform data from various sources (GitHub, Jira, etc.) into actionable insights for management and leadership teams.
- Scalability with Confidence. Invest in areas that demonstrably add value to your business, enabling strategic scaling with confidence.
- Multiple Integrations. Jellyfish integrates seamlessly with popular tools like Jira, Bitbucket, GitLab, Confluence, and Google Sheets, consolidating data from various sources into a unified view.
Pros:
- Offers valuable insights for resource allocation decisions
- Provides high-level summaries for executive briefings
- Transforms complex data into actionable insights for leadership teams
Cons:
- Limited user customization options for creating custom reports
- Learning curve associated with the user interface
Who is it perfect for? Engineering managers, product managers, software development teams
Ratings: Capterra: 4.5 out of 5 stars, G2: 4.6 out of 5 stars
SonarQube
This powerful platform empowers developers to continuously monitor code health, identify technical debt, and ensure maintainability throughout the development lifecycle.
Focus: Code quality and security for developers
Key Metrics:
- Code Maintainability. SonarQube analyzes code complexity, duplication, and commenting practices to assess overall maintainability. Maintainable code is easier to understand, modify, and debug, reducing long-term maintenance costs.
- Technical Debt. Identify areas of code that might require refactoring or improvement in the future. By addressing technical debt early, you can prevent it from accumulating and hindering development progress.
- Code Coverage. Measures the percentage of code that is tested by automated unit tests. Higher code coverage indicates a lower risk of bugs and defects.
- Security Vulnerabilities. SonarQube scans your codebase for known security vulnerabilities in libraries and dependencies. This proactive approach helps you identify and address potential security risks before they become exploited.
Benefits:
- Enhanced Security. Proactively identify and address security vulnerabilities in your codebase, safeguarding your software from potential attacks.
- Reduced Technical Debt. Continuously monitor technical debt and prioritize areas for improvement, ensuring long-term code maintainability.
- Customizable Rules. Configure SonarQube’s rules to align with your specific project requirements and coding standards. (While some reviews mention a lack of custom rule sets, it appears there is some level of customization available.)
- Multi-Language Support. Analyze code written in a wide range of programming languages, making SonarQube a versatile tool for diverse projects.
- Actionable Insights. SonarQube provides clear and actionable insights to help developers write cleaner, more maintainable code.
Pros:
- Offers security vulnerability scanning alongside code quality analysis
- Supports a wide range of programming languages
- Provides actionable insights to guide developers towards improved code quality
Cons:
- The user interface for the admin portal could be more user-friendly
- While customizable, some reviews suggest limitations in creating highly specific custom rule sets
Who is it perfect for? Developers of all levels, software development teams
Ratings: Capterra: 4.5 out of 5 stars, G2: 4.5 out of 5 stars
Pluralsight Flow

Feeling overwhelmed by the sprawl of data in your Git repositories? Look no further than Pluralsight Flow, the organizational mastermind for software development teams. Flow revolutionizes how engineering teams measure and communicate productivity, transforming raw Git data into actionable insights for success.
Focus: Developer productivity and workflow optimization
Key Metrics:
- Cycle Time. Tracks the average time it takes to complete a project, from initial development to deployment. Shorter cycle times indicate a more efficient workflow.
- Complexity. Flow analyzes code complexity, helping identify areas that might be difficult to understand, maintain, or extend.
- Cost. Gain insights into the projected financial resources required to complete a project.
- Risk Score. Flow calculates a risk score to proactively identify potential issues that could derail your project.
- Work in Progress (WIP) Limit Adherence Rate. Measures how well your team sticks to established limits on the number of concurrent tasks, promoting focus and efficiency.
- Code Coverage Metrics. Tracks the percentage of code that is tested by automated unit tests, indicating potential gaps in test coverage.
- Build Status & Deployment Frequency. Gain real-time visibility into your build success rates and deployment frequency, ensuring smooth delivery cycles.
Benefits:
- Data-Driven Decision Making. Move beyond gut feelings and make informed decisions based on comprehensive insights into team performance and project health.
- Improved Workflow Efficiency. Identify bottlenecks and optimize workflows to accelerate development velocity.
- Team Communication & Alignment. Flow fosters a data-driven culture, promoting clear communication and alignment between team members and stakeholders.
- Quantifiable Work. Flow empowers you to quantify engineering effort, making it easier to track progress and measure success.
- Motivational Metrics. Certain metrics can be leveraged to incentivize team members and foster a culture of continuous improvement.
- Multi-Repository Support. Manage data from multiple Git repositories within a single, unified platform.
Pros:
- Transforms raw Git data into actionable insights
- Offers a variety of metrics to measure team performance and project health
- Supports multiple Git repositories for centralized data management
Cons:
- Limited Jira integration capabilities
- Date range resets when switching reports (potential usability hurdle)
Who is it perfect for? Engineering managers, software development teams
Ratings: Capterra: 4.5 out of 5 stars, G2: 4.5 out of 5 stars
Code Climate Velocity

Designed for DevOps performance management, this tool provides data-driven insights into software delivery pipelines, helping teams achieve faster and more efficient development cycles.
Focus: DevOps performance management for high-velocity software delivery
Key Metrics:
- Deployment Frequency. Tracks how often your team releases new features and bug fixes to production. Higher deployment frequency indicates faster delivery of value to customers.
- Code Reviews. Measures the number of times code changes are reviewed before being merged. This metric helps ensure code quality and identify potential issues early in the development process.
- Work in Progress (WIP) Limit Compliance Rate. Analyzes how well your team adheres to established limits on the number of concurrent tasks, promoting focus and efficiency.
- Code Quality & Security. Gain real-time insights into code quality metrics and security vulnerabilities, enabling proactive risk mitigation.
Benefits:
- Holistic DevOps Visibility. Code Climate Velocity provides a comprehensive view of your entire software delivery pipeline, from code quality and code reviews to deployment frequency. This unified view empowers you to identify bottlenecks and optimize workflows for faster and more efficient development cycles.
- Data-Driven Decision Making. Make informed decisions about resource allocation, process improvements, and team performance based on real-time metrics and industry benchmarks.
- Actionable Insights & Risk Alerts. Velocity goes beyond reporting; it delivers actionable insights and real-time risk alerts, enabling you to address potential issues before they impact software quality or delivery timelines.
- Customizable Dashboards & Trends. Create personalized dashboards to track the metrics that matter most to your team and gain insights into historical trends for informed decision making.
- Integrated Velocity. Code Climate Velocity seamlessly integrates with popular tools like Jira and Git, streamlining data collection and presentation for a unified user experience.
Pros:
- Comprehensive overview of DevOps performance metrics
- Actionable insights and real-time risk alerts
- Customizable dashboards for data visualization
- Industry benchmark comparisons for informed decision making
- Seamless integration with popular development tools (Jira, Git)
Cons:
- Can be a costly option for smaller teams
Who is it perfect for? DevOps teams, software development teams
Ratings: Capterra: 4.5 out of 5 stars, G2: 4.5 out of 5 stars
ZenHub
ZenHub seamlessly integrates with GitHub, transforming your existing repositories into visual Kanban boards complete with agile automation features. This fosters increased visibility, real-time progress tracking, and dynamic task prioritization – all within the familiar environment of GitHub.
Key Metrics:
- Number of Critical Issues. Identify and prioritize critical bugs and enhancement requests that are road-blocking development progress.
- Number of Pending Pull Requests. Gain real-time insights into the number of outstanding pull requests awaiting review and merging.
- Number of Projects. Track the volume of projects your team is managing within ZenHub, helping assess workload and resource allocation.
Benefits:
- Enhanced Workflow Visibility. Visualize project progress at a glance with Kanban boards, fostering improved team communication and collaboration.
- Real-Time Progress Tracking. Monitor individual and team task completion, ensuring everyone stays on the same page.
- Dynamic Prioritization. Prioritize tasks and requests efficiently, balancing workload and responding effectively to changing business needs.
- Bottleneck Identification. ZenHub helps pinpoint bottlenecks that hinder development or testing cycles, enabling faster resolution and improved efficiency.
- Seamless GitHub Integration. Leverage the power of ZenHub without leaving your familiar GitHub environment.
Pros:
- Easy setup and integration with GitHub
- Intuitive user interface with minimal learning curve
- Powerful programmability for customization
Cons:
- Mobile experience needs improvement
- Admin functionalities could be more logically organized
Who is it perfect for? Agile development teams, software development teams
Ratings: Capterra: 4.4 out of 5 stars, G2: 4.4 out of 5 stars
How to Pick the Right Software Development Analytics Tools?
Choosing the perfect software development analytics tools for engineering managers can be a game-changer for your team’s efficiency and code quality. With an abundance of options available, navigating the selection process can feel overwhelming. However, by focusing on these key factors, you can ensure you select a tool that perfectly aligns with your team’s needs and development workflow.
Scalability
Consider the size and trajectory of your development team. Will the tool accommodate future growth in terms of users, projects, and data volume? A scalable tool should adapt to your evolving needs without compromising performance.
Error Detection & Code Health
Prioritize tools that offer robust error detection capabilities. Look for features that identify bugs, potential security vulnerabilities, and code smells early in the development process. Improved code health translates to faster development cycles, lower maintenance costs, and a more reliable product.
Security
In today’s digital landscape, security is paramount. Choose a tool that adheres to industry security standards and provides insights into potential vulnerabilities within your codebase. Additionally, some tools offer features to monitor open-source libraries for known security risks and help identify the introduction of malicious code.
User Experience (UX)
A user-friendly interface is crucial for maximizing adoption and ensuring your team derives full value from the chosen tool. Look for intuitive dashboards with clear visualizations and easy navigation. Ideally, the tool should offer customization options that cater to your specific workflows and preferences.
Integrations
Seamless integration with your existing development toolchain is essential. The ideal tool should integrate smoothly with your CI/CD pipeline, version control system (like Git), issue tracking system (like Jira), and any other development tools you rely on. This fosters a unified workflow and eliminates the need for manual data entry or context switching.
Conclusion
Choosing the right software development analytics tool is an investment in your team’s success. By leveraging data to identify bottlenecks, optimize workflows, and make informed decisions, you can empower your developers to write cleaner, more secure code, and deliver high-quality software faster.
Here at IntelliSoft, we understand the unique challenges faced by development teams. We offer a comprehensive suite of software development analytics tools designed to meet the specific needs of your organization. Our expert consultants can help you navigate the selection process, identify the perfect tool for your workflow, and ensure seamless integration with your existing development environment.
Ready to unlock the full potential of your development team? Contact IntelliSoft today for a free consultation and discover how our data-driven solutions can help you achieve your software development goals.
